 Martian Alpha
 6 CAN SLIM Strategy Screens You Can Run Today
Practical CAN SLIM checklist: six screening rules (18%+ quarterly EPS, RS 70+), a 4 step screen to trade workflow, and a 7–8% stop loss.
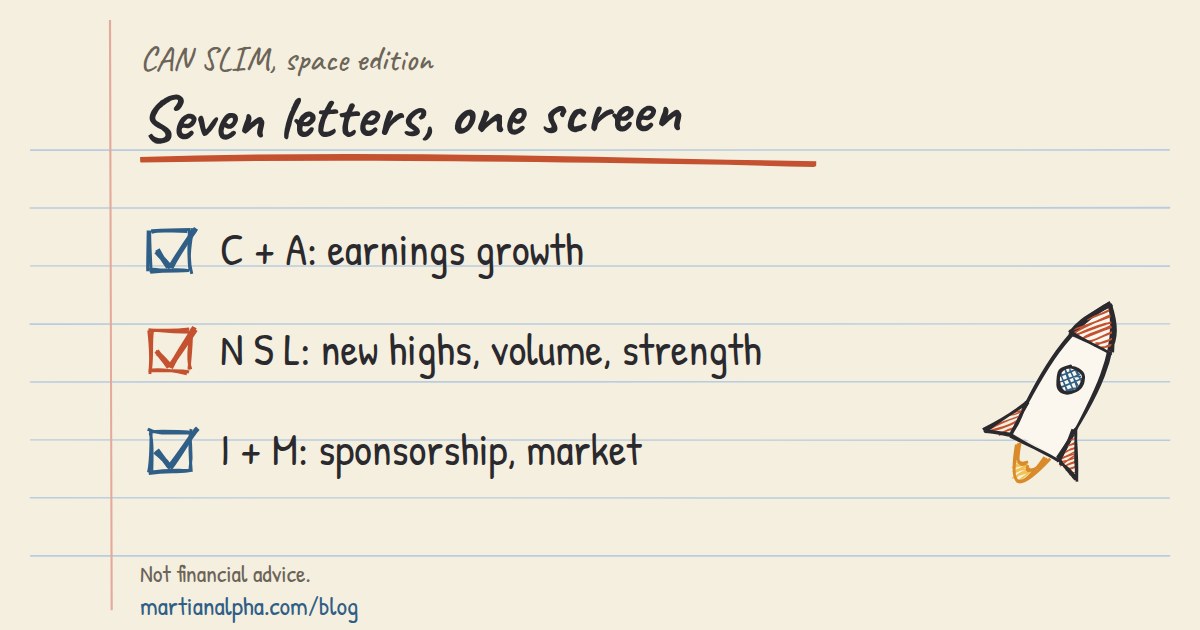
CAN SLIM is a seven-part stock selection system built to find growth stocks before their biggest price moves, combining earnings screens with chart-based entry rules. It works best for active investors with meaningful risk tolerance who can trade in confirmed market uptrends, cut losses fast, and monitor positions weekly rather than let them sit untouched. The core operational takeaway: pair earnings and institutional-ownership screens with technical buy points, then enforce a strict stop-loss on every trade.
TL;DR:
- Most stocks passing the fundamental filters show annual EPS growth above 18-25%, with a consistent three- to five-year track record and rising institutional ownership.
- Entry points should be confirmed by a proper base formation of at least seven weeks, with breakouts on volume significantly above the average; thin-volume breakouts are warning signs.
- Enforce a strict stop-loss of 7-8% below the buy point to protect capital, avoiding averaging down and tightening stops if market distribution days increase.
- The broad market trend dictates trade feasibility; even perfect stocks tend to underperform in confirmed downtrends, making market direction the ultimate filter.
- Automated tools like Martian Alpha can streamline screening, catalyst validation, volume checks, and alerts for breakout activity, especially in aerospace and space stocks.
What Does the CAN SLIM Strategy Stand For?#
William O'Neil built CAN SLIM as a rules-based system, not a shortcut to fast profits, and each letter targets a different piece of what makes a stock move before the crowd notices. According to the origin and rules behind CAN SLIM, the acronym breaks down into seven checks you run on every candidate.
- C, current quarterly earnings. Look at the most recent quarter's earnings-per-share growth compared to the same quarter a year earlier. You want acceleration, not just growth, and you should strip out one-time gains by focusing on continuing-operations figures.
- A, annual earnings. Check three to five years of annual EPS growth for consistency. A single great year means little if the four before it were flat or declining.
- N, new. This is the catalyst: a new product, service, management team, industry condition, or even a new price high. A credible N signal has something specific behind it, like a product launch date or a contract award, not just analyst optimism.
- S, supply and demand. Watch for volume spikes on up days, a manageable float, and modest shares outstanding. Fewer shares in circulation means institutional buying moves the price further.
- L, leader or laggard. Use relative strength or relative strength value (RSV) rankings to confirm the stock is outperforming most of the market, not trailing it. O'Neil's research consistently found leaders keep leading longer than most investors expect.
- I, institutional sponsorship. Rising ownership among mutual funds and other institutions signals accumulation. You do not need every fund buying in, just a clear upward trend in the count and quality of institutional holders.
- M, market direction. This is the gate that overrides everything else. AAII's analysis of CAN SLIM stresses that even a textbook-perfect stock underperforms when the broader market is in a confirmed downtrend, so trades only go on when the major indexes are trending up on rising volume.
Screening Thresholds You Can Apply Today#
Numbers turn CAN SLIM from theory into something you can run in a screener this afternoon. Investopedia's breakdown of the CANSLIM method lays out the ranges most practitioners use as a starting filter, though these are guidelines, not laws of physics.
- Quarterly EPS growth: screen for 18 to 25% or higher year-over-year, and treat smaller companies with smaller earnings bases with a bit more skepticism since a low starting number inflates the percentage.
- Annual EPS growth: look for consistent increases across the last three to five years, and pair it with a return on equity generally above 17% as a quality check.
- Relative strength ranking: target an RS or RSV score of 70 to 80 or higher, meaning the stock is outperforming the large majority of the market over the trailing 12 months.
- Float and shares outstanding: favor a manageable float relative to trading volume; a stock with too many shares outstanding often needs unusually large buying to move meaningfully.
- Institutional ownership minimums: confirm at least a handful of institutional holders with a rising trend in fund count quarter over quarter, not just a static number.
- Exclude one-off items: strip out asset sales, tax adjustments, and other non-recurring items from earnings before calculating growth, and always work from continuing-operations EPS rather than headline GAAP numbers when the two diverge.
Run these filters in that order. Numeric screens narrow a universe of thousands of stocks down to a short list fast, and that short list is what you take into chart review.
Buy Points, Chart Patterns, and the Stop-Loss Rule#
A stock can pass every numeric filter and still be a bad trade if you buy it at the wrong point on the chart. CAN SLIM treats the entry as its own discipline, separate from the fundamental screen.
- A valid base typically forms over at least seven weeks on the weekly chart, giving the stock time to consolidate before a genuine breakout, according to the technical rules within CAN SLIM.
- Cup-with-handle patterns are the most cited setup: a rounded bottom followed by a shorter, shallower pullback (the handle), usually retracing no more than 8 to 12% from its high before the breakout.
- Volume confirmation matters as much as price. A breakout above the base's resistance level should come on volume noticeably above the stock's 50-day average. A breakout on thin volume is a warning sign, not a green light.
- The stop-loss rule is non-negotiable: cut the position if it falls 7 to 8% below your buy point, no exceptions and no averaging down. This single rule does more to protect capital than any earnings screen.
- Tighten stops and raise cash as the broader market shows distribution days piling up, and consider trimming winners into strength rather than waiting for a reversal to do it for you.
Pro Tip: *Set your stop-loss order the moment you buy, not after the stock starts falling.
A tool like BitPulse can help you cross-check volume and accumulation signals against broader market data before you commit capital to a breakout.
How to Run a CAN SLIM Screen From Start to Finish#
Here's the workflow, step by step, from raw screen to a live position with protection in place.
- Apply the numeric filters first. Screen your universe for C, A, S, L, and I criteria simultaneously: quarterly EPS growth, multi-year annual growth, float and volume characteristics, relative strength above 70, and rising institutional ownership. This typically cuts thousands of stocks down to a few dozen.
- Check for N and validate the chart. For each remaining candidate, confirm there's a real catalyst (new product, new management, new industry trend) and pull up the weekly chart to look for a proper base, ideally seven weeks or longer, with a cup-with-handle or similar structure.
- Set buy orders at the breakout point and place stops immediately. Enter at the pivot price on volume confirmation, and place your stop-loss order 7 to 8% below that entry the same day. Size the position so a stop-out costs no more than a small, predefined percentage of total portfolio value.
- Monitor daily. Track overall market posture (is the trend still confirmed?), volume patterns on your positions, and any shifts in institutional ownership. Move partially or fully to cash when distribution days accumulate or the market direction signal turns negative.
Quick checklist to paste into your notes: EPS growth 18%+ ✓ | Annual growth consistent 3 to 5 years ✓ | Catalyst identified ✓ | RS 70+ ✓ | Institutional ownership rising ✓ | Base 7+ weeks ✓ | Volume confirmed on breakout ✓ | Stop-loss placed at buy ✓
What Experienced Practitioners Get Wrong#
The biggest mistakes with CAN SLIM aren't about missing a great stock. They're about discipline breaking down after the trade is already on. Investors skip the stop-loss "just this once," or they cherry-pick the criteria that fit a stock they already like while ignoring the ones that don't. Trading aggressively during a confirmed market downtrend is probably the costliest error, since even textbook setups tend to fail when the broader indexes are working against you.
Position sizing deserves more respect than it gets. Because CAN SLIM stocks are volatile growth names, keeping any single position to a modest slice of the portfolio, rather than concentrating heavily in one high-conviction pick, limits the damage when a stop-loss triggers. Favor established leaders with strong relative strength over speculative early breakouts when you're unsure. Many investors blend a CAN SLIM sleeve for growth and momentum with a separate buy-and-hold or value allocation, using the growth sleeve for offense and the steadier holdings to reduce overall portfolio swings.
Martian Alpha: Tools Built for Running CAN SLIM Faster#
Running the screening and monitoring workflow above by hand across hundreds of tickers eats hours you could spend actually managing positions. Martian Alpha is built around exactly that workflow, focused specifically on publicly traded space and aerospace companies rather than the broad market.
The platform's CANSLIM screener scores space-sector stocks on all seven letters with fixed rules: quarterly and annual earnings growth, a 52-week-high flag for "N", volume for "S", relative price strength for "L", a market-cap-based proxy for institutional sponsorship, and beta-adjusted momentum for "M". Because "I" is a proxy rather than actual 13F ownership data, check institutional holdings separately before acting on that letter. The launch calendar and catalyst feed help you judge the qualitative "N" (new products, missions, contract awards) instead of guessing whether a headline counts. Watchlist price and news alerts tell you when a candidate moves (our alert verification checklist helps you decide whether a move matters), chart tools support the base and cup-with-handle review, and AI-powered company summaries speed up the qualitative check on each candidate. Every core research tool stays free; the CANSLIM screener itself is free, and paid plans add higher AI limits and power-user tools (see the plans page for current pricing). If aerospace stocks fit your CAN SLIM watchlist, set up your screen on Martian Alpha and start narrowing your candidate list today.
Sources#
Core references for the thresholds and rules above: the CAN SLIM overview on Wikipedia, AAII's attribute analysis, Investopedia's CANSLIM explainer, and CFI's audience-fit summary.
This article is general information, not a substitute for advice from a qualified financial advisor. Consult a qualified financial professional about your own circumstances before acting on anything here.
- CAN SLIM - Wikipedia
- CAN SLIM: Seven Attributes That Set Market Leaders Apart - AAII
- CANSLIM Method by William O'Neil | Investopedia
FAQ#
Does the CAN SLIM method actually work?#
CAN SLIM has a documented track record through O'Neil's original research and independent variants like CAN SLIM No Float, both of which AAII has studied for historical performance. Results depend heavily on discipline: investors who skip the stop-loss rule or trade against confirmed market downtrends tend to underperform the strategy's own back-tested results.
What is the CAN SLIM strategy in simple terms?#
CAN SLIM is a seven-factor system for finding growth stocks with strong earnings, a real catalyst, institutional buying, and rising relative strength, then entering only on confirmed technical breakouts during market uptrends. Each letter in the acronym targets a different piece of what historically preceded major stock advances.
What are the best stocks for a CAN SLIM screen right now?#
There's no fixed list. The best candidates are whichever stocks currently pass all seven filters, quarterly and annual earnings growth, a genuine catalyst, high relative strength, rising institutional ownership, and a valid technical base, at the same time. A CANSLIM screener like the one on Martian Alpha applies these filters continuously to aerospace and space stocks so the list updates as conditions change.
Can I make $1,000 a day trading with CAN SLIM?#
CAN SLIM was designed as a disciplined, rules-based approach to identifying strong growth stocks, not a guaranteed daily income system. Daily results swing widely based on market conditions, position sizing, and how strictly you follow the stop-loss and market-direction rules, so treat any specific daily profit target as unrealistic rather than a reasonable expectation.
This article is for information only and is not financial advice. Do your own research before making any investment.