 Martian Alpha
 Verify Space ETF Holdings Before You Trust the Weights
Learn to verify space ETF holdings: check issuer "as-of" dates, compare top-10 weights to spot concentration risk, and pull daily CSVs or SEC filings.
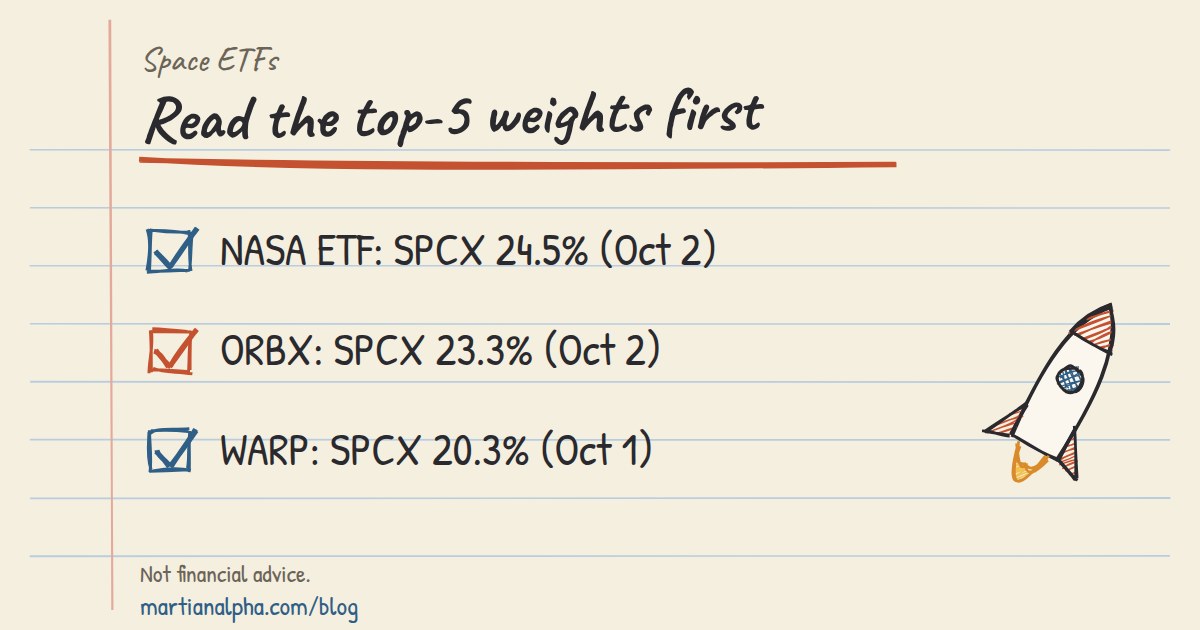
Holdings figures were checked on the issuers' own pages on October 4, 2026 (as-of dates given with each figure). Fund weights change daily, so check each issuer's holdings page for the current numbers.
Space ETFs overlap more than most investors expect. Names like Space Exploration Technologies Corp (SpaceX, listed on Nasdaq as SPCX since June 12, 2026), Rocket Lab, AST SpaceMobile, and Viasat show up as top-10 holdings across nearly every fund in the category, though the weight each gets varies enormously. Some funds, like the Amplify Top 10™ Space ETF, deliberately concentrate around a handful of names, while others spread exposure across 60 or more companies. Before you act on any single weighting, check the "as of" date on the issuer's holdings page or the fund's most recent SEC filing. Snapshots go stale fast in a sector this volatile.
TL;DR:
- Some space ETFs put a fifth or more of their assets in one company: Space Exploration Technologies Corp (SPCX) was 24.50% of the Tema Space Innovators ETF (NASA) on October 2, 2026 and 20.28% of the VanEck Space ETF (WARP) on October 1, 2026.
- Diversified funds like UFO spread risk across dozens of companies, making their holdings more stable but potentially less focused on industry leaders.
- Overlap in top holdings does not imply redundancy; differences in weighting levels significantly impact individual fund risk profiles.
- Holdings data can become outdated rapidly in this volatile sector, so always verify the "as of" date and source before acting.
- Recheck holdings on the issuer's page after big news, as sector catalysts can quickly alter fund exposures between official updates.
Comparing Space ETF Holdings Side by Side#
Seven ETFs dominate the space investing conversation right now, and they take genuinely different approaches to portfolio construction. The gap between the most concentrated fund and the most diversified one is wide enough to change your risk profile entirely, depending on which you pick.
The Procure Space ETF (UFO) holds 68 positions with a 0.75% expense ratio, spreading risk across satellite operators, launch companies, and ground infrastructure firms. In the top-10 list on Procure's page in early October 2026, SPCX was the largest weight at 15.80%, followed by Rocket Lab (5.62%) and then Garmin, EchoStar, Trimble, AST SpaceMobile, Viasat, Sirius XM, Planet Labs and Iridium at roughly 3% to 5% each. Even here, one name is several times bigger than the rest.
The Global X Space Tech ETF (ORBX) is also top-heavy: on October 2, 2026 its page showed SPCX at 23.34%, Rocket Lab at 10.72% and AST SpaceMobile at 9.28%, with Iridium, Globalstar, MDA, Viasat, Firefly, Redwire and Intuitive Machines at about 4% to 5% each (expense ratio 0.50%). ORBX publishes a full downloadable holdings CSV, which makes it one of the easier funds to audit line by line.
VanEck's Space ETF (WARP) runs noticeably more top-heavy: 22 holdings, with SPCX at 20.28% and Rocket Lab at 14.84% of net assets on October 1, 2026, followed by AST SpaceMobile, Viasat, EchoStar, Iridium and Globalstar. That kind of concentration can swing fund performance sharply on company-specific news.
XWNG, GALX, MARS, and NASA round out the group, each with its own design philosophy; check each issuer's methodology page for how it selects and weights holdings (our space index methodology guide shows what to look for).
The pattern that matters most: since SpaceX listed in June 2026, most space ETFs have a large SPCX position, from about 16% in UFO to about 20% to 25% in WARP, ORBX and NASA (early October 2026). Breadth of holdings (68 in UFO, 22 in WARP, 10 in XWNG) tells you less than the top-five weights do. Also check size: Amplify's XWNG launched on August 19, 2026 and its page showed net assets of about $1.1 million, which matters for trading costs and the fund's staying power.
The Stocks That Keep Reappearing (and What They Do)#
A small cluster of companies anchors nearly every space ETF on the market, regardless of how the fund is constructed. Recognizing their industry role helps you understand what you're actually buying exposure to.
- Space Exploration Technologies Corp operates as a launch provider and satellite network operator, appearing in ORBX's top holdings and reaching 24.50% of the Tema Space Innovators ETF (NASA) and 20.28% of WARP in early October 2026.
- Rocket Lab functions as a launch provider with growing satellite manufacturing operations, showing up across UFO, ORBX, and MARS holdings lists.
- AST SpaceMobile builds direct-to-device satellite communications infrastructure and ranks among the top holdings in both UFO and ORBX.
- Viasat provides satellite communications and connectivity services, a fixture in UFO, ORBX, and WARP portfolios alike.
- Iridium and Globalstar both operate satellite communications networks and show up repeatedly as mid-to-large weights across multiple funds.
Weight ranges for these recurring names vary widely fund to fund. A single company might have a modest weighting in a broadly diversified ETF like UFO and a substantially higher weighting in a concentrated, top-heavy fund like WARP. That spread creates real single-stock risk: a launch failure, a regulatory setback, or a missed earnings report at one of these companies can move an entire fund's return, not just a sliver of it.
Pro Tip: Don't assume two "space ETFs" give you similar exposure just because they share a sector label. Pull the top-10 lists side by side before you buy. A fund with a quarter of its assets in one company behaves nothing like one spread across 67 positions.
How to Verify Space ETF Holdings Before You Trust Them#
Holdings data goes stale fast in this sector, so build a quick verification habit before acting on any number you see in a screenshot or a secondhand comparison chart.
- Confirm the "as of" date and source. Pull the number straight from the issuer's daily holdings page or CSV, not a cached screenshot from a blog post or forum thread.
- Measure concentration. Add up the top-5 and top-10 weights. A fund where the top five names account for more than half the portfolio behaves very differently than one where they account for 20%.
- Compare sector and country weights to your thesis. If you want exposure to launch providers specifically, check whether the fund is actually weighted there or spread thin across communications and IT services instead.
- Watch for red flags. Large derivative or swap exposure, inconsistent "as of" dates across sections of the same fact sheet, unusually small AUM, or high turnover all signal a fund that may not behave the way its name suggests. Amplify's own documentation notes that XWNG's weightings can reflect positions held through total return swaps rather than direct stock ownership, which changes how you should interpret its top-10 list.
Pro Tip: If a fund's AUM sits well below $50 million, treat its holdings percentages as more volatile day to day. Small funds can see outsized weight swings from a single large buy or redemption order.
Where to Pull Verified Holdings Data#
The most reliable hierarchy runs from issuer to regulator, in that order. Start with the fund's own daily holdings page or downloadable CSV, since that's the freshest source available. Cross-check against the published fund fact sheet, which usually updates monthly and includes expense ratio and AUM alongside top holdings. For the highest level of verification, SEC filings offer machine-readable holdings data that can confirm what the issuer discloses on its own site.
| Source type | Update frequency | Best use |
|---|---|---|
| Issuer daily holdings / CSV | Daily | Real-time weight checks |
| Fund fact sheet | Monthly | Expense ratio, AUM, sector breakdown |
| SEC filings | Periodic (quarterly/annual) | Independent verification |
An example SEC holdings filing shows how granular this data can get once you go straight to the regulatory source. If two sources disagree, check whether one reports holdings net of swaps or on a different NAV date. Aggregator sites like ETFdb's space ETF list are useful for scanning the category quickly, but they can lag issuer updates by days.
Why Holdings Overlap Doesn't Mean Redundancy#
Most investors assume that if two space ETFs share seven of their top-10 names, buying both is pointless. That's not quite right, and it's worth pushing back on.
The overlap in names is real, but the weighting differences are where the actual investment decision lives. A fund like UFO holding Rocket Lab at a relatively small weight, spread among many other names, delivers a fundamentally different risk exposure than a concentrated fund holding the same stock at several times that weight. You're not choosing between "space ETF A" and "space ETF B" as interchangeable wrappers. You're choosing how much conviction you want in a handful of names versus how much diversification you want across an entire emerging industry.
The bigger risk most retail investors overlook isn't overlap. It's staleness. Space is a catalyst-driven sector, launch delays, contract wins, regulatory shifts, and a fund's top-10 list from three months ago can already misrepresent its current exposure. Treat every holdings page like a photograph, not a live feed, unless you've confirmed the timestamp yourself.
Track Space ETF Holdings Changes Without Refreshing a Spreadsheet#
Checking issuer pages one by one every time a launch fails or a contract gets announced is not a sustainable habit for anyone tracking this sector seriously. The holdings themselves are where the news happens, so it helps to watch those companies directly rather than waiting for the next fact sheet.
On Martian Alpha's free plan, the dashboard shows a market-cap-weighted composite of tracked space stocks against the S&P 500 with a sector heat map, the launch calendar and catalyst feed list the events that move the largest ETF holdings, and a watchlist sends price and news alerts for up to 10 tickers. To compare two of the top holdings side by side on valuation and growth, use Compare. The fund weights themselves should still come from each issuer's own holdings page.
Sources#
FAQ#
What Is the Best ETF for Space Stocks?#
There's no single "best" fund. It depends on whether you want broad diversification, which the Procure Space ETF (UFO) offers across 68 holdings, or concentrated conviction in fewer names, which funds like XWNG (10 holdings) or WARP (22) provide. Match the fund's concentration level to your own risk tolerance rather than chasing whichever fund performed best last quarter.
Which ETF Is Better, NASA or UFO?#
The two funds take different approaches: UFO spreads exposure across 67 holdings with a 0.75% expense ratio, favoring diversification, while the Tema Space Innovators ETF (NASA) applies its own selection methodology to a narrower innovator-focused universe. Compare their top-10 lists and expense ratios directly on each issuer's page before deciding which fits your thesis.
What Are the Top 10 Holdings of the ETF NASA?#
The Tema Space Innovators ETF's exact top-10 list isn't standardized in this comparison, since Tema doesn't publish the same CSV-level detail as some peer funds. Check Tema's own fund page directly for the current "as of" date and full holdings breakdown before making any allocation decision.
What Are Some Promising Space Stocks to Watch?#
Names that recur across multiple ETF top-10 lists include Space Exploration Technologies Corp, Rocket Lab, AST SpaceMobile, Viasat, Iridium, and Globalstar, spanning launch, satellite communications, and infrastructure roles. Their appearance across funds like UFO and ORBX signals broad institutional conviction, though individual weight and risk vary sharply by fund.
How Often Do Space ETF Holdings Change?#
Holdings can shift daily as issuers rebalance, though most funds only trigger significant weight changes around catalyst events like launches, contract awards, or earnings surprises. Always check the issuer's daily holdings page rather than relying on a fact sheet that may be weeks old.
This article is for information only and is not financial advice. Do your own research before making any investment.